USER MANUAL
Welcome to the user manual for the BrainMapper software.
Welcome to the user manual for the BrainMapper software.
Contents - Clustering
Go back to home page
brain-Mapper aims to allow the user to use the interesting data from NIfTI files to perform clustering algorithms and thus determine the different groups of voxels.
To accomplish this, brain-Mapper extracts the data from NIfTI files and allows you to select the method you would like to apply. Clustering results can be exported as a CSV file or
saved in the application, and thus be exported as new NIfTI files.
In this section we explain the main functionalities of our software around clustering
The NIfTI format is an image format but for some teams it is interesting to apply clustering algorithms on the list of voxels, usually represented as a list of
[X_coordinate,Y_coordinate,Z_coordinate, Intensity] entries, each of which represent a voxel.
Our software extracts the data of your selected image collections before applying clustering algorithms on it.
From the main view page, where all collections are accessible, the user can click on 'clustering' button at the bottom right, once he has selected some image collections.

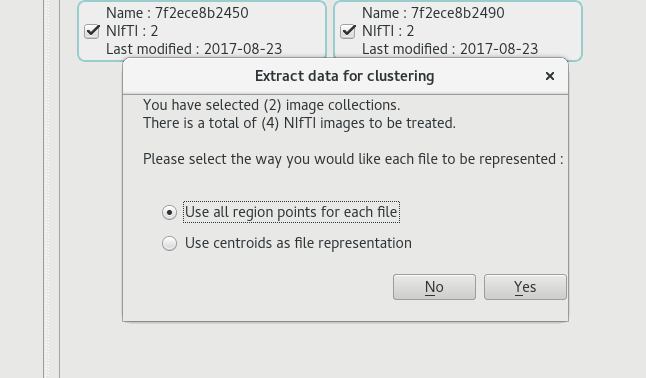
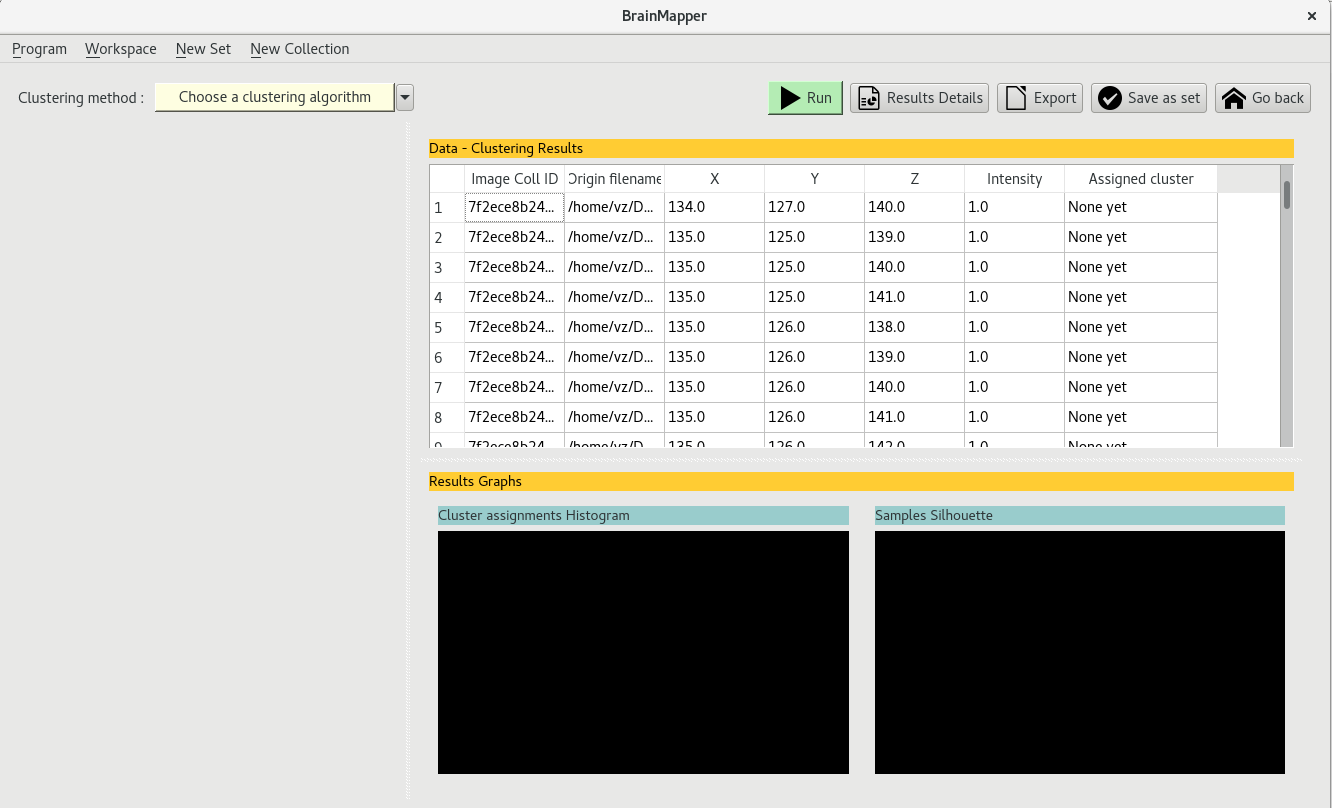
When all points are selected by choosing 'Use all region points for each file', the data used for clustering is the list of all voxels whose intensity is greater than 0.
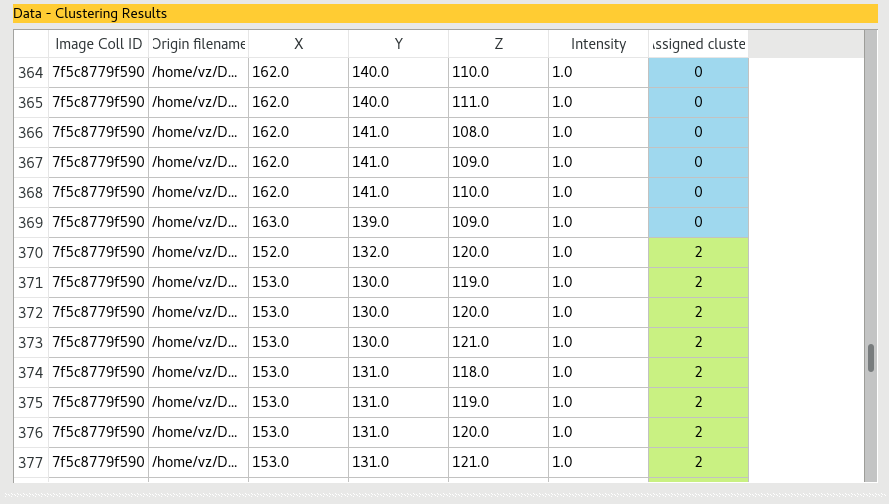
The clustering view thus contains a data table with several data entries
By choosing 'Use centroids as file representation', the data used for clustering is the a list of a single voxel per file, which represents the mean voxel or center
of all the voxels in the image. This type of extraction might take a while longer than the simple extraction, because several calculations are done.
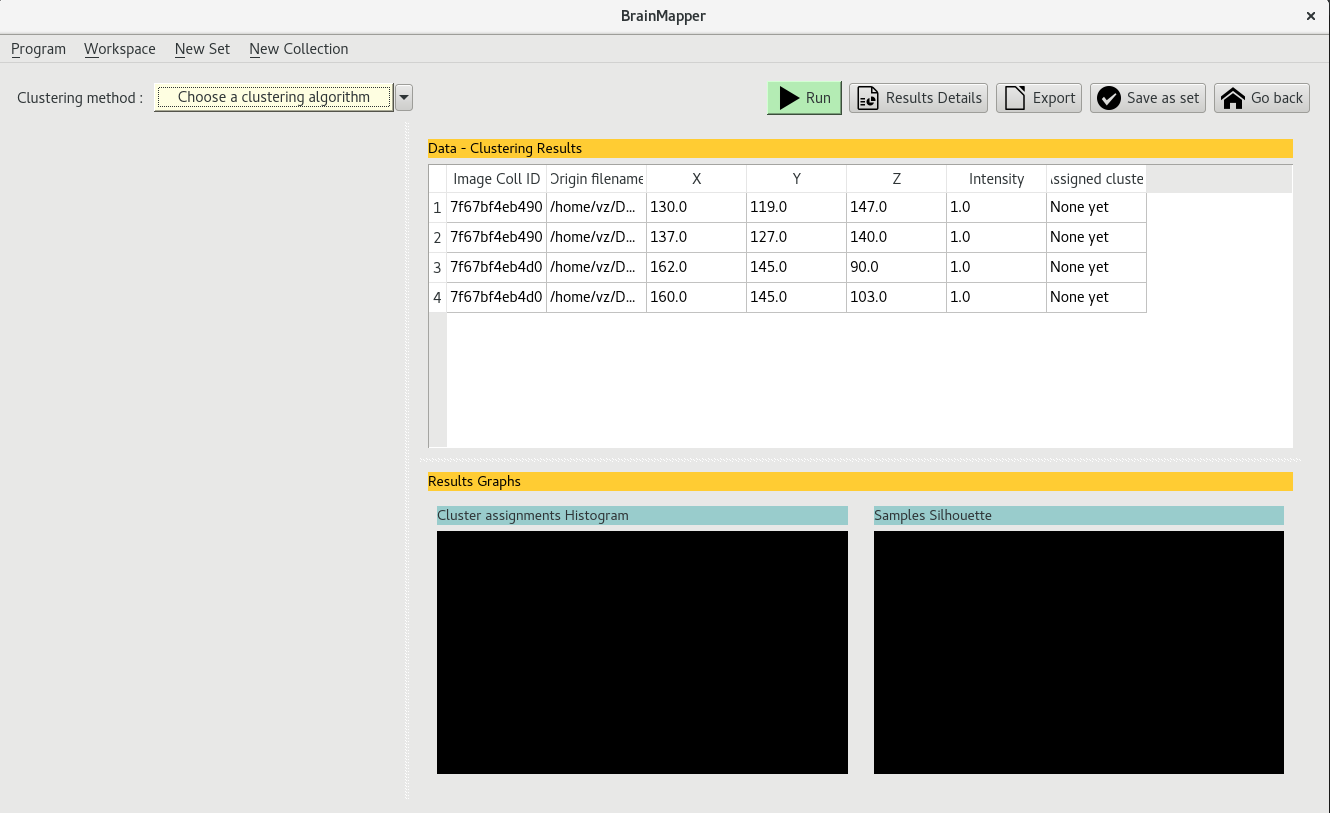
The clustering view thus contains a data table with a single data entries per selected file : if a total of 4 files in 2 different image collections were selected, the data table
will display 4 data entries
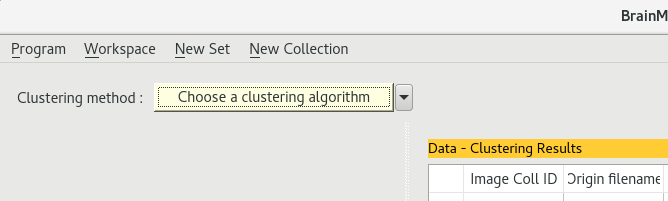
Once you have extracted the data from the selected images, you can choose which algorithm clustering to apply by clicking on the yellow bar at the top left ont the clustering view.
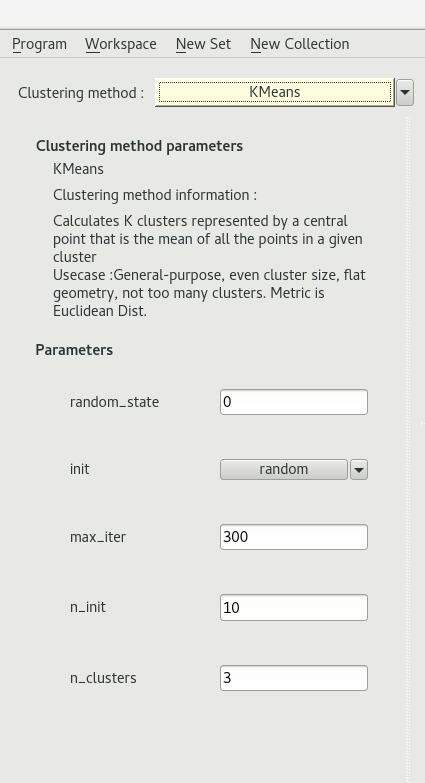
The KMeans algorithm is a classic clustering algorithm.
We used the implementation from the scikit-learn library.
For more details on the algorithm and its parameters click here
The KMedoids algorithm is an alternative to KMeans when you want the centroid of each cluster is the median point of each cluster.
Agglomerative clustering, specially Ward Linkage, is sometimes used in neuroimaging. It is a Hierarchical clustering algorithm.
We used the implementation of this type of algorithm from the scikit-learn library.
For more details on its parameters click here
In the clustering method chooser, you may see the option 'Custom user script'.
By selecting it the user can write the algorithm she/he would like to apply to the extracted data.
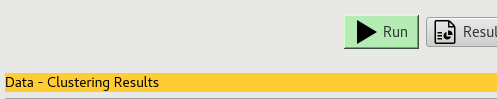
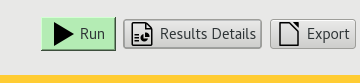
Once the selected clustering method parameters have been correctly set, you can launch the algorithm by clicking on the 'Run' button
The data table will be modified to display which data entry belongs to which cluster.
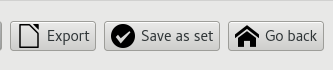
By clicking on the 'Save as set' button, a NIfTI file containing all points from a given cluster will be recreated,
for each cluster obtained. A set containing this results will be added in the main page, in the 'Clustering' tab.
They can be exported as NIfTI files from there.
By clicking on the 'Export' button, a CSV file containing the data table can be saved on the disk
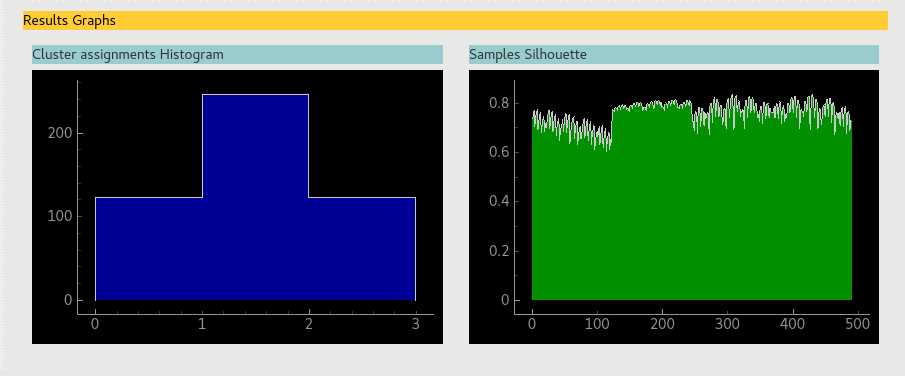
Two graphic visualisations can give additional information on clustering results.
One of these graphs represents the proportion of data entries assigned to each cluster with an histogram (the graph in blue).
The second graph plots the Silhouette values for each data entry after cluster assignment (the graph in green).
Internal validation indexes can be useful when one needs to determine which clustering execution is to be retained as conclusive.
In this version of brainMapper, validation indexes are calculated automatically after a clustering algorithm is applied on data.
The internal validation indexes of the current version are :
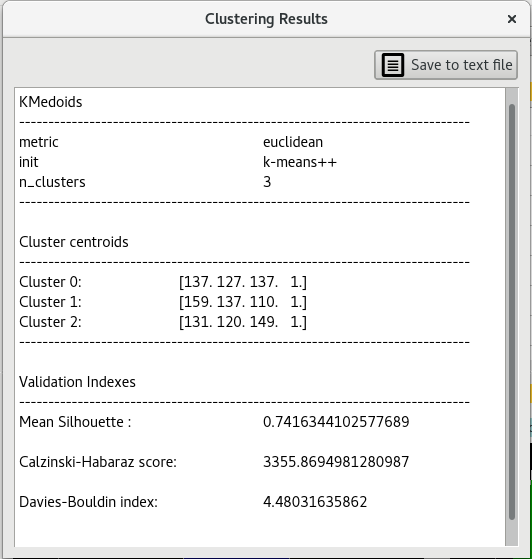
Mean silhouette index is calculated with the according function from scikit-learn library. For more details click here
Calinski-Habaraz score is computed with the according function from scikit-learn library. For more details click here
Davis-Boulin index is a way to evaluate clustering algorithms using the features of the dataset.